
Accurate valuation is the cornerstone of smart investing in the world of finance. Whether you’re a retail investor analyzing stocks or a financial analyst evaluating acquisition opportunities, knowing how to value a business correctly can give you a substantial edge. Among the various valuation models available, one method stands out for its fundamental approach and widespread adoption: the Discounted Cash Flow (DCF) method.
This blog post dives deep into the DCF method, explaining what it is, how it works, and how you can use it to assess a company’s intrinsic value. From basic principles to step-by-step calculations and common pitfalls, you’ll walk away with a comprehensive understanding of one of the most powerful tools in valuation.
Table of Contents
- What is the DCF Method?
- Why Use DCF?
- Core Principles of DCF
- Components of DCF Analysis
- Free Cash Flow (FCF)
- Discount Rate (WACC)
- Terminal Value
- Step-by-Step DCF Calculation
- Real-World Example of a DCF Valuation
- DCF vs Other Valuation Methods
- Strengths and Weaknesses of DCF
- Common Mistakes to Avoid
- Tools and Software for DCF Modeling
- Final Thoughts
1. What is the DCF Method?
The Discounted Cash Flow (DCF) method is a valuation technique used to determine the intrinsic value of a business or asset based on its expected future cash flows. The core idea is simple yet powerful: the value of a business is equal to the present value of its future cash flows.
In other words, DCF helps you answer the question: “How much is this company worth today, given the cash I expect it to generate in the future?”
2. Why Use DCF?
There are several reasons why DCF is one of the most preferred valuation methods among finance professionals:
- Fundamental-Based: It’s rooted in actual business performance.
- Forward-Looking: Unlike ratios based on historical data, DCF projects future performance.
- Adaptable: Can be applied to companies of all sizes and sectors.
- Investor-Focused: It aligns with the idea that investments should generate future cash returns.
3. Core Principles of DCF
To fully understand DCF, it’s essential to grasp three underlying concepts:
A. Time Value of Money (TVM)
A dollar today is worth more than a dollar tomorrow. This foundational concept justifies discounting future cash flows to their present value.
B. Cash is King
DCF focuses on cash flows, not accounting profits. Cash flows represent real value that can be returned to investors.
C. Risk and Return
The discount rate used in DCF reflects the riskiness of the cash flows. Riskier businesses require higher discount rates to justify the investment.
4. Components of DCF Analysis
Let’s break down the key components that go into a DCF model:
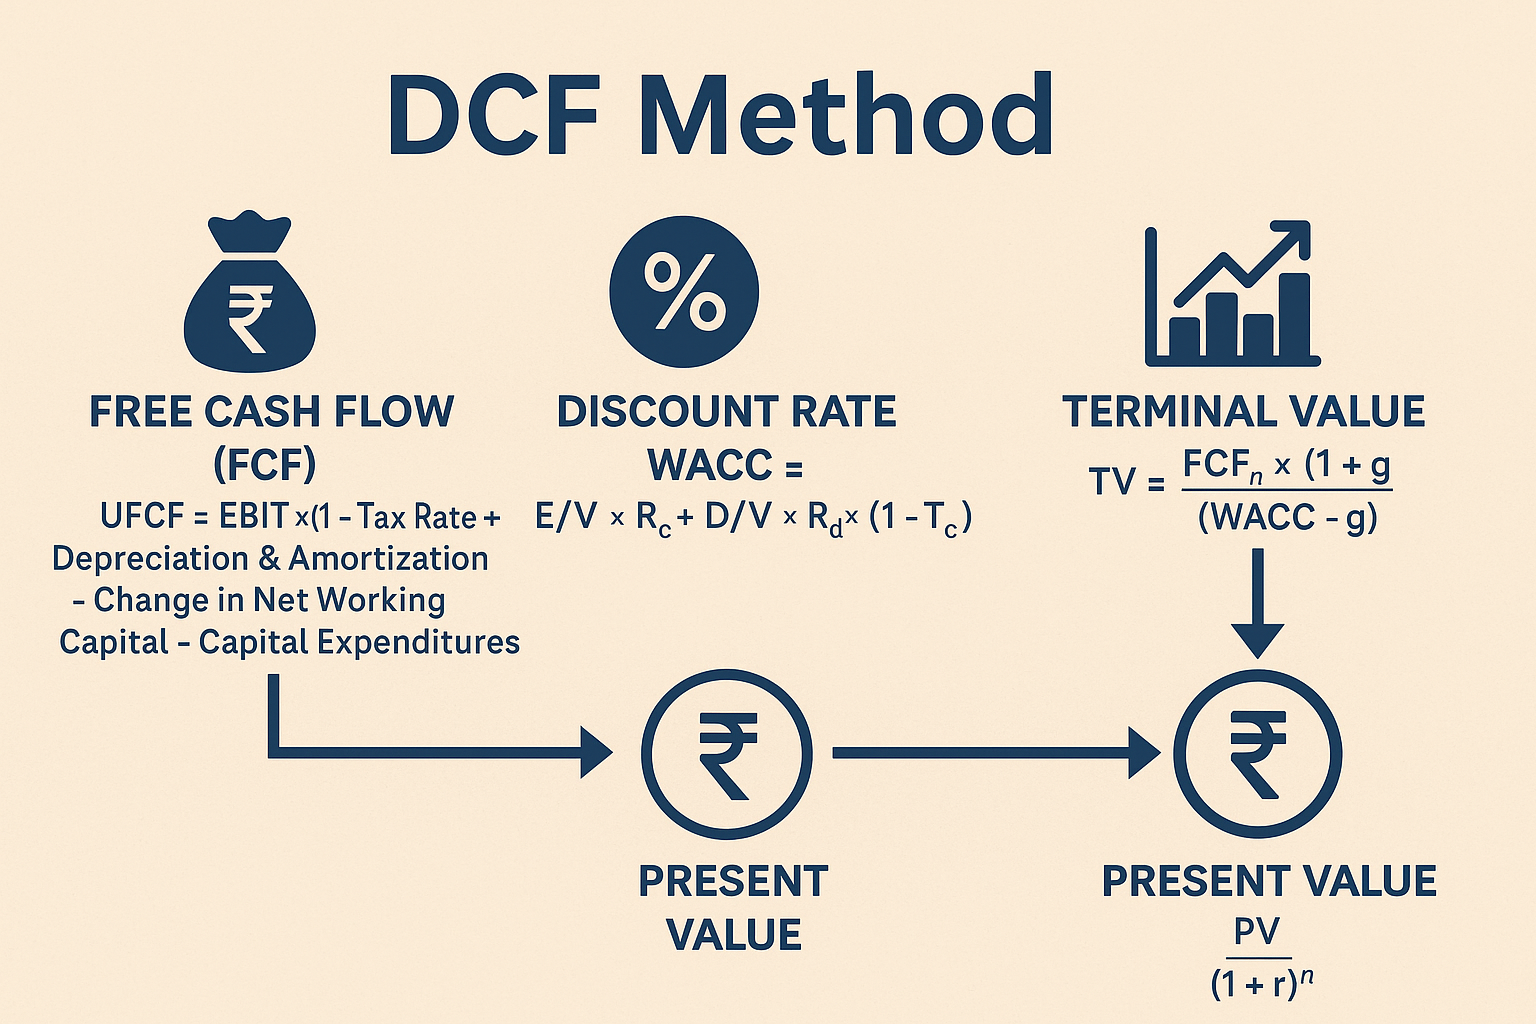
A. Free Cash Flow (FCF)
Free Cash Flow is the cash generated by a company after accounting for capital expenditures. It represents the cash available to all capital providers (debt and equity).
There are two types commonly used:
- Unlevered Free Cash Flow (UFCF): Cash available to both debt and equity holders.
- Levered Free Cash Flow (LFCF): Cash available only to equity holders, after interest payments.
Formula for UFCF:
UFCF = EBIT × (1 – Tax Rate) + Depreciation & Amortization – Change in Net Working Capital – Capital Expenditures
B. Discount Rate (WACC)
The Weighted Average Cost of Capital (WACC) is used as the discount rate in a DCF model using UFCF. It reflects the average rate of return required by both debt and equity investors.
WACC Formula:
WACC = (E/V × Re) + (D/V × Rd × (1 – Tc))
Where:
- E = Market value of equity
- D = Market value of debt
- V = E + D
- Re = Cost of equity
- Rd = Cost of debt
- Tc = Corporate tax rate
C. Terminal Value (TV)
Most businesses generate cash flows indefinitely, so we can’t forecast forever. Instead, we calculate a terminal value at the end of the forecast period to capture the value beyond that point.
Terminal Value Methods:
- Gordon Growth Model (Perpetuity Growth):
TV = (FCF in final year × (1 + g)) / (WACC – g)
- Exit Multiple:
TV = Final Year EBITDA × Chosen Multiple
5. Step-by-Step DCF Calculation
Let’s outline a typical DCF workflow:
Step 1: Forecast Free Cash Flows
Build detailed projections for 5-10 years based on historical performance, industry trends, and company guidance.
Step 2: Calculate the Terminal Value
Choose either the Gordon Growth or Exit Multiple method to estimate the value beyond the forecast period.
Step 3: Determine the Discount Rate
Use the WACC formula or CAPM for equity cost estimation.
Step 4: Discount Cash Flows to Present Value
Use the following formula:
PV = FCF / (1 + WACC)^n
Sum the present value of forecasted cash flows and the discounted terminal value.
Step 5: Adjust for Debt and Cash
To get the equity value:
Equity Value = Enterprise Value – Net Debt
Step 6: Calculate the Intrinsic Value Per Share
Divide the equity value by the number of outstanding shares.
6. Real-World Example of a DCF Valuation
Let’s walk through a simplified example.
Assume:
- Forecasted UFCFs for 5 years: ₹50M, ₹55M, ₹60M, ₹65M, ₹70M
- WACC = 10%
- Terminal growth rate = 3%
- Final Year FCF = ₹70M
- Shares outstanding = 10M
- Net debt = ₹100M
Step 1: Present Value of Cash Flows
| Year | FCF (₹M) | Discount Factor (10%) | Present Value (₹M) |
|---|---|---|---|
| 1 | 50 | 0.909 | 45.45 |
| 2 | 55 | 0.826 | 45.43 |
| 3 | 60 | 0.751 | 45.06 |
| 4 | 65 | 0.683 | 44.40 |
| 5 | 70 | 0.621 | 43.47 |
Step 2: Terminal Value
TV = (70 × 1.03) / (0.10 – 0.03) = ₹1,030M
Discounted TV = ₹1,030M × 0.621 = ₹639.63M
Step 3: Total Present Value
Enterprise Value = 45.45 + 45.43 + 45.06 + 44.40 + 43.47 + 639.63 = ₹863.44M
Step 4: Equity Value
Equity Value = ₹863.44M – ₹100M = ₹763.44M
Intrinsic Value Per Share = ₹763.44M / 10M = ₹76.34
If the current market price is below ₹76.34, the stock is undervalued according to the DCF model.
7. DCF vs Other Valuation Methods
| Method | Basis | Pros | Cons |
|---|---|---|---|
| DCF | Cash flow & time value | Fundamental, intrinsic | Sensitive to assumptions |
| Comparable Company | Market ratios (P/E, EV/EBITDA) | Quick benchmark | Lacks precision |
| Precedent Deals | Historical transactions | Market-based | No two deals are the same |
| Asset-Based | Book value of assets | Useful for liquidation | Ignores cash generation |
8. Strengths and Weaknesses of DCF
Strengths
- Intrinsically driven
- Forward-looking
- Applicable across sectors
- Helps justify long-term investments
Weaknesses
- Highly sensitive to assumptions
- Difficult for unpredictable companies
- Time-consuming and complex
9. Common Mistakes to Avoid
- Overly optimistic projections
- Ignoring working capital requirements
- Incorrect discount rate
- Inconsistent terminal value assumptions
- Not updating models regularly
Always test assumptions using sensitivity analysis (e.g., changing WACC, growth rate) to check how robust your valuation is.
10. Tools and Software for DCF Modeling
You can use the following tools for building or reviewing DCF models:
- Microsoft Excel / Google Sheets – Most popular for custom models
- Finbox – Pre-built DCF calculators for listed companies
- Morningstar – Offers intrinsic valuation insights
- Yahoo Finance / TIKR – Useful for data collection
- Valuation app plugins – Tools like AlphaSense or Sentieo for analysts
11. Final Thoughts
The DCF method is a powerful valuation tool when used properly. It forces you to think critically about a company’s future performance, risks, and capital needs. However, its accuracy depends entirely on the quality of your assumptions. Used wisely, DCF can help you identify investment opportunities others may overlook.
If you’re serious about value investing or corporate finance, mastering the DCF method is non-negotiable. Learn to build, interpret, and critique DCF models – and you’ll be well on your way to becoming a sophisticated investor.
Have questions about DCF or want a free DCF calculator template? Drop a comment or reach out – let’s build smarter valuations together.
Leave a Reply