
Understanding financial statements is a vital skill for investors, business owners, accountants, and even job seekers aiming to get into finance. Financial statements tell the story of a company’s financial health, its profitability, liquidity, and potential for growth. Yet many people find them confusing or intimidating.
This guide will break down the essential components of financial statements and show you how to analyze them like a seasoned professional.
Why Financial Statements Matter?
Before diving into the specifics, it’s important to know why you should understand financial statements. These documents provide insights that help you:
- Make informed investment decisions
- Understand a company’s performance over time
- Assess financial risks and rewards
- Communicate effectively with stakeholders
- Evaluate whether a company is under- or over-valued
Whether you’re reviewing your own business finances or looking into companies to invest in, financial statements are your best friend.
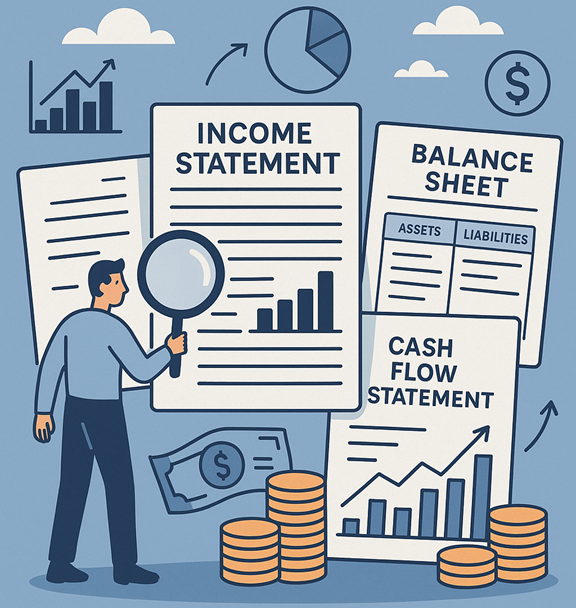
The Big Three Financial Statements
Professionals focus on three main financial statements:
- Income Statement (also called Profit and Loss Statement)
- Balance Sheet
- Cash Flow Statement
Each one serves a unique purpose. Let’s look at them one by one.
1. The Income Statement – Tracking Profitability
The income statement shows how much revenue a company earned during a period and what expenses it incurred to earn that revenue. The goal is to calculate net income, also known as profit.
Key Components of the Income Statement:
- Revenue (Sales): Total income from products or services.
- Cost of Goods Sold (COGS): Direct costs of producing goods or services.
- Gross Profit: Revenue minus COGS.
- Operating Expenses: Costs related to running the business (e.g., salaries, rent, marketing).
- Operating Income: Gross profit minus operating expenses.
- Other Income/Expenses: Interest, investment gains/losses, etc.
- Taxes: Amount paid to the government.
- Net Income: Final profit after all expenses and taxes.
How to Read It Like a Pro:
- Check Revenue Trends: Compare revenue across multiple periods to spot growth or decline.
- Evaluate Profit Margins:
- Gross Margin = Gross Profit / Revenue
- Operating Margin = Operating Income / Revenue
- Net Margin = Net Income / Revenue
- Look for Consistency: Spikes in revenue or expenses may indicate non-recurring events.
- Watch for Non-Operating Items: One-time gains or losses can distort real performance.
2. The Balance Sheet – Snapshot of Financial Health
The balance sheet shows a company’s financial position at a specific point in time. It includes assets, liabilities, and equity.
Formula:
Assets = Liabilities + Equity
This equation must always balance.
Key Sections:
Assets:
- Current Assets: Cash, accounts receivable, inventory (can be converted to cash within a year).
- Non-Current Assets: Property, equipment, patents (long-term resources).
Liabilities:
- Current Liabilities: Accounts payable, short-term debt (due within a year).
- Long-Term Liabilities: Loans, bonds payable, deferred taxes.
Equity:
- Shareholder Equity: Money invested by owners plus retained earnings.
- Retained Earnings: Profits not distributed as dividends.
How to Analyze It Like a Pro:
- Liquidity Ratios: Can the company meet short-term obligations?
- Current Ratio = Current Assets / Current Liabilities
- Quick Ratio = (Current Assets – Inventory) / Current Liabilities
- Leverage Ratios: How much debt is the company carrying?
- Debt-to-Equity = Total Liabilities / Shareholder Equity
- Asset Utilization: Is the company using its assets effectively?
- Return on Assets (ROA) = Net Income / Total Assets
- Evaluate Equity Growth: A growing equity base indicates retained earnings and financial strength.
3. The Cash Flow Statement – Real Cash Movement
While the income statement uses accrual accounting (recording revenue when earned), the cash flow statement tracks the actual flow of cash in and out of a company.
Sections:
- Operating Activities: Day-to-day business cash flows (cash from customers, payments to suppliers).
- Investing Activities: Cash used for or from buying/selling assets, such as equipment or investments.
- Financing Activities: Cash flow from loans, issuing shares, or paying dividends.
How to Use It Like a Pro:
- Free Cash Flow (FCF) = Operating Cash Flow – Capital Expenditures
- Positive FCF indicates the company can expand, repay debt, or return money to shareholders.
- Check for consistency between net income and operating cash flow.
- A company that reports high net income but negative operating cash flow may have liquidity issues.
Tips to Read Financial Statements Like a Pro
1. Start with the Income Statement
The income statement tells you whether the company is making money. Begin here to see revenue trends, cost control, and profitability.
2. Use the Balance Sheet to Evaluate Stability
After confirming that a business is profitable, look at its balance sheet. Is it financially sound? Does it carry too much debt? Can it survive a downturn?
3. Cross-Check with the Cash Flow Statement
Even if a company looks profitable, it may have cash flow problems. Make sure its cash from operating activities is healthy. Avoid companies with repeated negative cash flows.
4. Review Financial Ratios
Professional analysts rely on ratios to make sense of raw data. Use common ratios like:
- Current Ratio – liquidity
- Debt-to-Equity – leverage
- Return on Equity (ROE) – profitability
- Price-to-Earnings (P/E) – valuation
- Earnings Per Share (EPS) – profitability per share
5. Compare with Industry Averages
A good company in a bad industry may still struggle. Always compare key metrics to competitors or industry standards.
6. Read the Footnotes and MD&A Section
Don’t skip the footnotes or the Management Discussion and Analysis (MD&A). These sections provide crucial context, such as:
- Changes in accounting methods
- Details on pending lawsuits or risks
- Management’s future plans or concerns
Red Flags to Watch Out For
Professionals look for warning signs that may suggest trouble ahead. Here are a few:
- Rising Debt without corresponding growth in revenue or profits.
- Negative Cash Flow from Operations over multiple periods.
- Decreasing Gross Margins, suggesting rising costs or pricing pressure.
- Large One-Time Gains or Losses that inflate earnings.
- Inventory Build-Up, which may indicate slowing sales.
- Frequent Changes in Accounting Policies, which can obscure real performance.
Tools Professionals Use
Reading financial statements manually is important, but professionals often use tools and software to make analysis easier. Here are a few:
- Microsoft Excel: Great for building models and calculating ratios.
- Power BI or Tableau: Helpful for data visualization.
- Yahoo Finance, Morningstar, or EDGAR: Offer access to public filings and financial data.
Practice Makes Perfect
The more financial statements you review, the easier they become. Start by analyzing publicly traded companies, which must release quarterly and annual reports. Look up companies you’re interested in and download their latest 10-K (annual report) or 10-Q (quarterly report).
Set up a spreadsheet and begin tracking:
- Revenue trends
- Profit margins
- Key ratios
- Cash flow patterns
Over time, you’ll begin to recognize patterns and gain confidence in your analysis.
Final Thoughts
Learning to read financial statements like a pro doesn’t require a finance degree. It takes patience, practice, and a curiosity to understand what lies beneath the numbers. Think of financial statements as the X-ray of a company-they reveal its strengths, weaknesses, and long-term potential.
By mastering the basics of the income statement, balance sheet, and cash flow statement, and applying professional-grade analysis techniques, you’ll make smarter financial decisions and gain a powerful advantage in business or investing.
Leave a Reply