
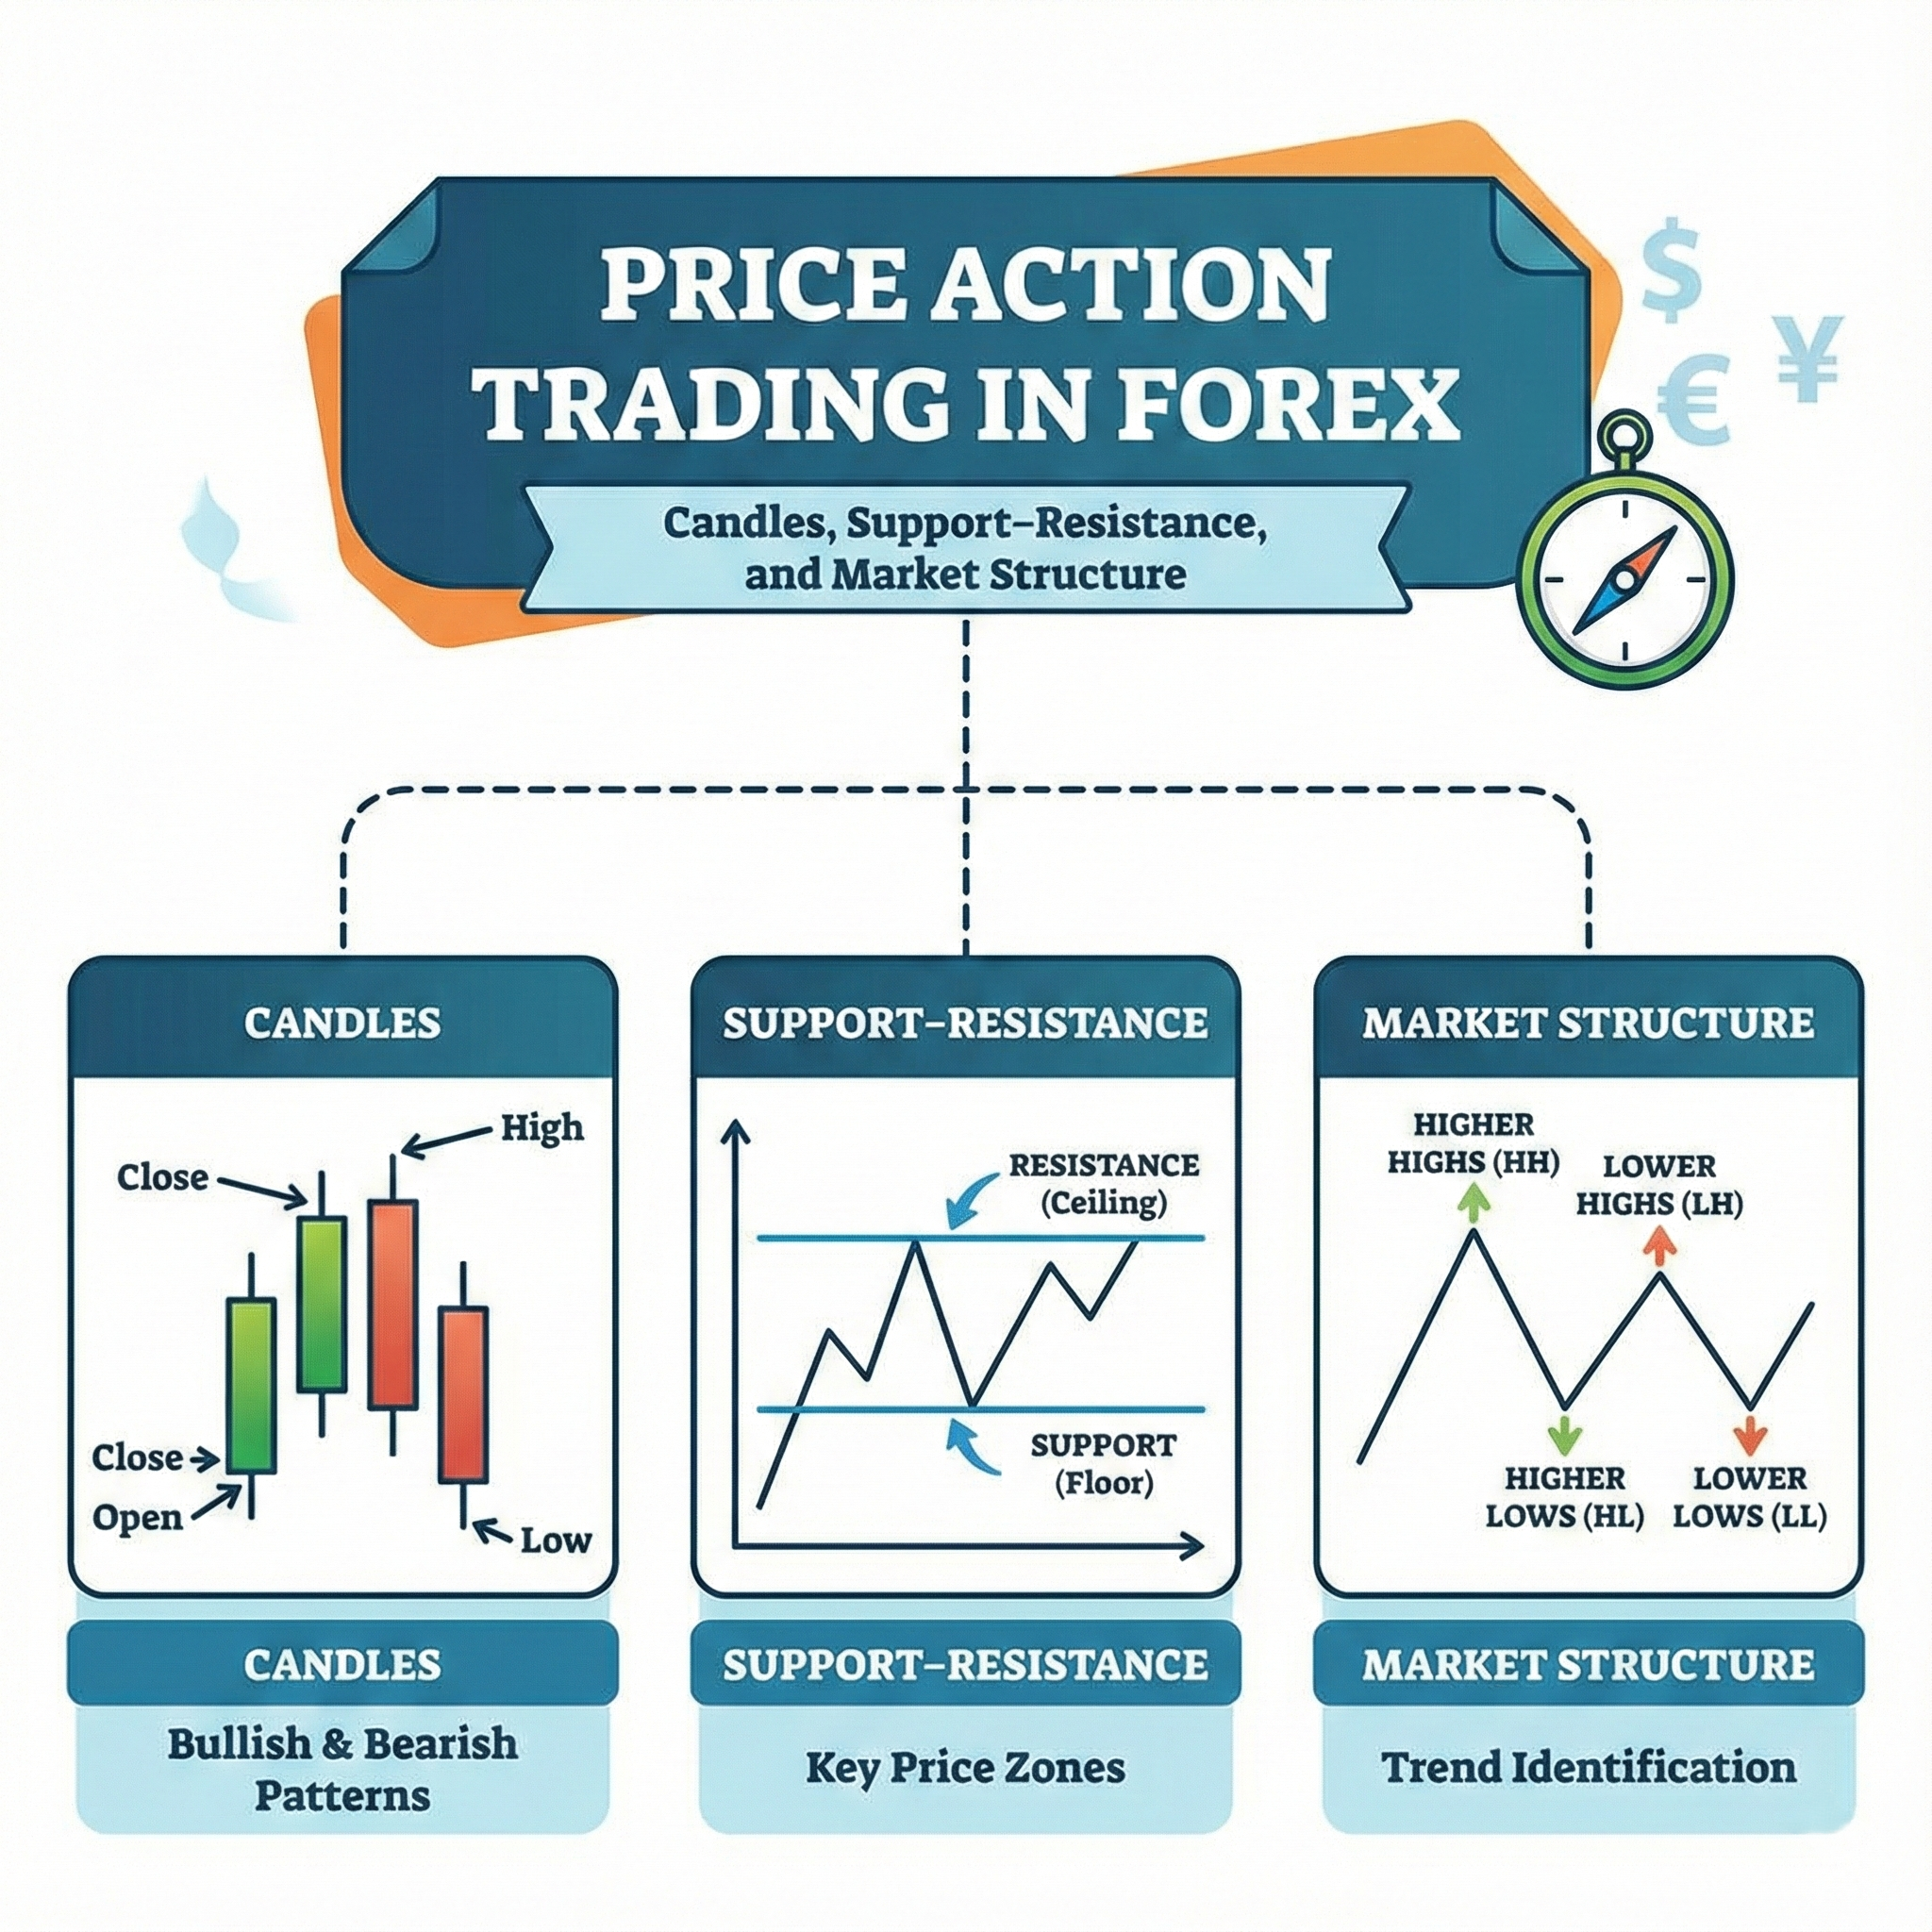
Price action trading gives you a clear view of the market without loading your chart with indicators. Many beginners feel lost when they first open a forex chart, yet price action removes the confusion. You learn to read candles, identify key levels, and follow market structure. These three elements build a complete trading system. Although learning them takes time, the payoff is worth it because you gain confidence with every chart you study.
Why Price Action Works for Beginners
Most new traders jump between indicators because they believe complex tools create better results. Instead, price action shows you how the market actually moves. You watch how buyers and sellers behave, where they struggle, where they win, and where they fail. As you study these reactions, patterns begin to appear. Soon after, you learn to predict how the market might respond at certain levels. This direct way of reading charts removes noise and gives you clarity, especially when you combine candles, support-resistance, and structure.
Understanding Candlestick Charts: Your Starting Point
Candlestick charts are the foundation of price action. Each candle captures a battle between buyers and sellers during a specific time period. Although the concept seems simple, each candle contains valuable clues. You see where the price opened, how high it moved, how low it dropped, and where it closed. With this information, you start understanding market behavior without guessing.
Moreover, candlestick patterns highlight shifts in momentum and sentiment. You can use these signals to confirm entries, filter trades, and avoid weak setups. Because candles appear on every timeframe, you can apply the same skills whether you prefer the 1-hour chart or the daily chart.
The Two Parts of a Candlestick
Every candlestick has a body and wicks. The body shows the distance between the open and close. When the candle closes above the open, it forms a bullish candle. When the close sits below the open, the candle turns bearish. Strong candles usually have large bodies because aggressive buyers or sellers pushed the market in one direction.
Although the body tells you direction, the wick reveals the market’s struggle. The upper wick shows how far buyers pushed before sellers stepped in. The lower wick marks the lowest point sellers reached before buyers responded. Because of this, wicks show rejection, pressure, and hidden strength. Long wicks often mark turning points, while short wicks show controlled movement.
Why Wicks Matter So Much
Most beginners focus on bodies, yet wicks often carry stronger meaning. A long upper wick shows rejection from a higher price. A long lower wick shows rejection from a lower price. These rejections point to areas where one side failed to hold control. When you combine this information with support or resistance, you often find high-quality trade entries.
For example, if price reaches a strong support level and prints a candle with a long lower wick, buyers may be defending that area. Although this doesn’t guarantee a reversal, it suggests that sellers are weakening. When followed by a bullish candle, the signal becomes stronger. Many profitable traders build their strategies around these simple patterns.
Essential Candlestick Patterns for Beginners
Price action trading includes dozens of candlestick patterns. However, beginners only need a few reliable ones to understand the market. As you gain experience, you naturally see more patterns, but these core setups will shape your early development.
1. The Doji
A doji forms when the opening and closing prices are nearly equal. This creates a candle with a small body and wicks on both ends. Because neither side wins this battle, the doji signals indecision. When a doji appears at a key level, it often warns that a reversal or breakout may be near.
Although not every doji carries weight, the ones that appear after long trends or at major zones deserve attention. They usually show momentum fading. Once the next candle forms, you often get a clear direction.
2. The Hammer
A hammer has a small body near the top and a long lower wick. Sellers pushed the price down, yet buyers forced the candle to close near the top. This pattern often appears at support levels during downtrends. When it does, the market may be preparing to move higher.
Although the hammer looks simple, beginners rely on it because the story behind it is easy to grasp. Sellers tried to break the level, but buyers stepped in with strength. When the next candle confirms the move, traders look for buying opportunities.
3. The Shooting Star
The shooting star mirrors the hammer but forms near resistance. The candle has a small body at the bottom and a long upper wick. Buyers tried to break higher, yet sellers rejected the move. When this happens at a key level, the market often prepares for a drop.
Although many traders jump into trades the moment they see this candle, patient traders wait for confirmation. A strong bearish candle after the shooting star usually signals the start of a move.
4. Engulfing Patterns
Engulfing patterns appear when a candle completely covers the previous candle’s body. These patterns show a sudden shift in control. A bullish engulfing candle swallows a bearish one and signals strong buying. A bearish engulfing candle covers a bullish one and signals strong selling. Because sentiment flips quickly during engulfing moves, these setups often produce sharp reactions.
5. Pin Bars
A pin bar has a small body and a long wick on one side. Traders use them to spot reversals because the wick exposes strong rejection. For example, a bullish pin bar has a long lower wick. That wick shows sellers failed to push lower. On the other hand, a bearish pin bar has a long upper wick and forms when buyers fail to continue upward.
Although pin bars appear often, the best ones form at support or resistance. They carry far more meaning when aligned with structure and levels.
6. Inside Bars
Inside bars form when a candle’s range fits within the previous candle’s range. They act as pauses within the market. Because the market slows down temporarily, the inside bar often precedes a breakout. When you see an inside bar at key levels, expect the next move to be strong.
Why Support and Resistance Matter So Much
Most traders lose money because they enter the market in random places. They buy while price sits under heavy resistance, or they sell right into strong support. When you ignore key levels, the market punishes you. Yet once you understand how these zones work, you begin trading where probability sits in your favor.
Moreover, support and resistance reveal how the market remembers past behavior. A level that stopped price last week can do the same today because traders react emotionally. Big banks also place orders around familiar levels, so these areas attract real volume and real movement. With this context, your trades become more intentional.
What Support and Resistance Really Represent
Support is a zone where buying pressure repeatedly pushes price upward. Resistance is a zone where selling pressure pushes price downward. Many beginners think these levels are exact lines, but the market doesn’t move in perfect precision. Instead, price reacts in areas. Because of that, thinking in zones helps you avoid premature entries and exits.
Although these zones look simple on a chart, the psychology behind them is powerful. Traders who missed previous moves often wait for price to return to these levels. Once price reaches the zone again, they enter with strong conviction. This behavior creates predictable reactions that you can use for high-quality setups.
How to Identify Strong Support and Resistance Zones
Spotting these levels becomes easier with practice. However, you can follow a straightforward process to build accuracy from the start.
1. Start With Higher Timeframes
Open the daily chart first. Look for swing highs and swing lows where price turned sharply. These turning points usually mark important zones. Because the daily chart filters out noise, the levels you draw here tend to be more reliable. After marking them, move down to the 4-hour or 1-hour chart for refinement.
2. Look for Multiple Touches
The more times price reacts to a level, the stronger that zone becomes. Although two touches can be enough, three touches show that the level matters to both buyers and sellers. Because many traders look at the same spots, reactions become predictable. Still, avoid overloading your chart with too many lines. Focus on the clearest levels.
3. Draw Zones, Not Thin Lines
Support and resistance rarely sit at exact prices. For example, if price bounced from around 1.2500 several times, treat 1.2490–1.2510 as the zone. This gives you breathing room for entries and stop-loss placement. Beginners often lose trades by placing stops right on the level, where the market loves to poke through before reversing.
4. Identify Fresh Levels
Fresh levels are zones that price has not touched recently. They carry more strength because orders usually remain unfilled there. When the market revisits these fresh zones, reactions tend to be large. Experienced traders actively search for these untouched levels because they often produce explosive moves.
Types of Support and Resistance
Although horizontal levels are the most common, other forms of support and resistance exist. Understanding these variations gives you an advantage because markets don’t always move in straight lines.
Horizontal Support and Resistance
Horizontal levels come from clear swing highs and lows. Traders love these levels because they appear clean and obvious. Moreover, they often act as launchpads for strong reversals and breakouts. When you combine horizontal levels with candlestick patterns, you get a simple but powerful trading blueprint.
Trendline Support and Resistance
Trendlines form when you connect a series of rising lows in an uptrend or falling highs in a downtrend. These diagonal levels help you track the market’s direction. Because price often respects these lines, trendline touches create great opportunities. Still, trendlines require judgment since slight adjustments can change their angle. Treat them as guides, not absolute rules.
Dynamic Support and Resistance
Moving averages act as dynamic support and resistance. Price often bounces off certain moving averages when trending strongly. The 20 EMA, 50 EMA, and 200 EMA are popular choices. Although you shouldn’t rely on them alone, they help confirm direction and potential bounce areas. When the market respects a moving average consistently, pay attention.
Supply and Demand Zones
Supply and demand zones represent areas where large institutions placed heavy orders. Supply zones sit above price and trigger selling, while demand zones sit below price and trigger buying. These zones often create sharp movements because of the large orders involved. Although they require more skill to identify, they produce some of the cleanest trades in price action.
How to Trade Support and Resistance
Trading support and resistance becomes easier once you know how to combine them with candles and structure. Although many traders jump into trades at the first touch, patience often pays better. Clear confirmation gives you higher accuracy.
1. The Bounce Setup
In a bounce setup, price approaches support or resistance, forms a clear candlestick pattern, and then moves in the opposite direction. For example:
- Price falls toward support.
- A hammer or bullish pin bar forms.
- Price reverses upward.
This setup works because buyers defend the level. A clean rejection candle signals that momentum has shifted.
2. The Breakout Setup
Sometimes price breaks through strong levels with force. When the breakout comes from consolidation, it often leads to big moves. Still, waiting for a retest gives you a safer entry. Many traders lose money by entering at the moment of breakout because false breakouts happen frequently. Instead, wait for price to return to the broken level. If it holds as new support or resistance, your risk drops and your probability increases.
3. The Fakeout Setup
A fakeout happens when price temporarily breaks a level, triggers stops, and then snaps back in the opposite direction. This move often traps emotional traders. Smart traders wait for confirmation before entering. When the market returns inside the zone quickly, momentum usually shifts fast.
4. Stop-Loss Placement Around Levels
Your stop-loss should sit beyond the zone, not on it. Because markets love sweeping obvious stops, placing them too close invites unnecessary losses. Although wider stops may feel uncomfortable at first, proper position sizing protects your account. When support or resistance truly holds, price should never reach your stop.
Common Mistakes Beginners Make With Levels
Many beginners misuse support and resistance by drawing too many zones. When your chart becomes crowded, you lose clarity. Focus only on major levels and fresh zones. Additionally, avoid trading every touch. The best setups occur when levels, candles, and structure align. Because of that, patience becomes one of your biggest weapons.
Another mistake involves ignoring context. A level that works well in a ranging market might fail in a strong trend. When the market trends hard, support and resistance often break quickly. In these moments, follow structure first. Levels matter more when structure backs the move.
Why Market Structure Matters More Than Most Beginners Realize
Many new traders jump into trades because they spot a strong candle or a pattern they learned online. Although these signals can help, they lose meaning if they appear against market structure. For example, a bullish pin bar inside a strong downtrend often fails, not because the pattern is weak, but because structure is against it. When you trade with structure, you have the market’s momentum on your side.
Furthermore, structure helps you avoid emotional decisions. A clear trend removes doubt. You stop asking whether you should buy or sell because the chart tells you. Once you train your eyes to see the sequence of highs and lows, the market becomes far easier to read.
The Three Types of Market Structure
Every chart falls into one of three categories: bullish, bearish, or sideways. Although the market constantly shifts, these three structures repeat endlessly. Because the patterns repeat, you can build trading rules around them.
1. Bullish Market Structure
A bullish structure forms when the market prints higher highs and higher lows. Each low sits above the previous low, and each high breaks the previous high. This consistent climb shows that buyers control the market. As long as the market continues this pattern, the trend remains healthy.
Although bullish markets give many buying opportunities, the best ones appear near higher lows. These pullbacks often trap impatient sellers while giving disciplined buyers favorable entries. Because the trend already shows strength, trades taken in the direction of that strength usually perform better.
2. Bearish Market Structure
Bearish structure moves in the opposite direction. The market prints lower lows and lower highs. Sellers push prices down repeatedly, and buyers struggle to reverse the trend. Each time the market rallies, the move fails earlier than the previous one. This tightening behavior reveals weakness in buying pressure.
Although bearish markets scare new traders, experienced traders see clean opportunities. Selling at lower highs gives you low-risk entries. Because momentum supports your trade, your decision becomes straightforward. As long as structure stays intact, sellers remain in control.
3. Sideways or Ranging Structure
Sometimes the market pauses. It prints equal highs and equal lows, bouncing between two boundaries. This sideways structure frustrates many beginners because signals look strong one moment and weak the next. Trend strategies often fail inside ranges, and breakout traders get trapped repeatedly.
Although ranging markets look dull, they prepare the next major trend. The longer the range, the stronger the breakout. When you notice a tight sideways structure, stay patient. A breakout with a clean retest often leads to some of the best trades you’ll ever take.
How to Read Market Structure Step by Step
Learning structure takes practice, but you can follow a simple process to build your skill. With time, the pattern becomes second nature.
1. Identify the Most Recent High and Low
Start by marking the most recent swing high and swing low. These points give you the reference you need. Once you mark them, check how the following moves compare. If the next high breaks the previous high, structure may be shifting bullish. If the next low breaks the previous low, structure may be turning bearish.
2. Track the Sequence of Highs and Lows
After identifying your reference points, trace the chart backward. Look at the previous swing points and compare their positions. This step reveals the trend direction. If you notice a consistent pattern of higher highs and higher lows, the market is trending up. If you see lower highs and lower lows, the trend is down.
Although this step looks simple, it trains your eyes to see order in what appears chaotic. As you gain experience, you’ll recognize shifts quickly.
3. Watch for Breaks in Structure
Market structure doesn’t last forever. Eventually, every trend weakens. A break in structure signals that the market might be changing direction. For example, if the market has been forming higher lows and suddenly prints a lower low, the trend may be losing strength. Even if the full reversal hasn’t formed yet, this break creates a warning.
Furthermore, a break in structure often sparks new opportunities. When a bullish trend breaks, sellers prepare to step in. When a bearish trend breaks, buyers begin looking for countertrend setups.
4. Combine Structure With Support and Resistance
Structure alone gives direction, but levels clarify where to trade. For example, if a bullish structure pulls back into a strong support zone, the probability of a bounce increases. If a bearish structure rallies into resistance, the probability of a drop increases.
Although structure tells you when the market is healthy, support and resistance tell you where to act. When you combine both, your decisions become far more accurate.
5. Confirm With Candlestick Behavior
Candles complete the picture. Structure sets the background, levels outline the zones, and candles give the entry signal. Because every candle reveals momentum, you get real-time confirmation. When all three align, you often get clean and reliable trades.
Recognizing Shifts and Reversals in Market Structure
Structure shifts occur when the pattern of highs and lows changes. These shifts often signal trend reversals or major pullbacks.
1. Bullish Reversal Signs
A bullish reversal begins when a downtrend stops creating lower lows. Once price forms a higher low, the trend may be shifting. Although the move needs confirmation, the early sign is clear. Buyers are stepping in faster and sellers are losing control. When a higher high appears afterward, the bullish reversal becomes stronger.
2. Bearish Reversal Signs
A bearish reversal starts when an uptrend stops printing higher highs. When price forms a lower high, buyers are slowing down. Once a lower low forms, sellers take control. Although you shouldn’t jump in too early, this pattern often signals the start of a downtrend.
3. Reversal Traps
Not every break in structure guarantees reversal. Sometimes price fakes a break, sweeps liquidity, and returns to the original direction. These traps occur often around support and resistance zones. When in doubt, wait for additional confirmation through candles or retests.
How Market Structure Shapes Your Trading Decisions
Once you understand structure, your job becomes easier. You stop fighting the trend and start flowing with it.
1. Only Trade in the Direction of Structure
Trading with structure gives you the highest probability setups. When structure shows a clear uptrend, look only for buys. When it shows a downtrend, look only for sells. This simple rule eliminates many bad trades.
2. Use Pullbacks as Entry Opportunities
Pullbacks offer low-risk entries. They occur when price returns toward structure before continuing the trend. These moments give you better pricing, tighter stops, and higher reward potential. Because structure guides these moves, you know where to look.
3. Use Breaks in Structure to Spot Trend Changes Early
Although reversals confuse many beginners, structure reveals them before other signals do. Once you see the pattern shift, adjust your bias. A trader who adapts quickly survives longer and profits more consistently.
4. Avoid Countertrend Trades Until You Gain Experience
Countertrend trades require fast reactions and deep understanding. New traders often get burned trying to pick tops and bottoms. Stay with the trend until reading structure becomes second nature.
Why Combining All Three Creates High-Probability Setups
Candlestick patterns reveal the short-term story. Support and resistance define the battlefield. Market structure shows the bigger direction. When all three point the same way, your trade makes logical sense. Instead of hoping for luck, you rely on evidence. Although no setup guarantees success, the probability jumps sharply when these elements match.
Moreover, combining these elements filters out weak trades. If you see a hammer but it forms in the middle of nowhere, you ignore it. If price touches resistance but structure is bullish and strong, you avoid shorting. This discipline protects your account and keeps you focused on the best opportunities.
The Price Action Confluence Approach
Confluence occurs when several pieces of analysis line up. Many professional traders rely on confluence because it simplifies decision-making. Instead of reacting emotionally, you check whether the trade meets your rules. If it does, you execute. If not, you wait.
Here’s a simple confluence checklist:
- Market structure must support the direction.
- Price must be near support or resistance.
- A clear candlestick pattern must appear.
- The reward-to-risk ratio must make sense.
- The stop-loss must fit the structure.
When all points align, the setup usually carries strong potential. When even one element fails, your risk increases.
Popular Price Action Setups for Beginners
Although price action offers endless variations, a few setups appear often and deliver consistent results. Because these setups rely on simple logic, they work well for beginners.
1. The Support Bounce Setup
This setup appears when a bullish structure pulls back to support and forms a reversal candle. For example:
- Market forms higher highs and higher lows.
- Price pulls back into a strong support zone.
- A bullish pin bar or engulfing candle appears.
This combination signals that buyers are defending the zone. Because structure supports the trade, the setup becomes reliable.
2. The Resistance Rejection Setup
This setup mirrors the support bounce but during a downtrend. When price rallies into resistance and prints a bearish pattern, sellers regain control. Strong setups often form at fresh resistance levels because buyers have fewer reasons to push through.
3. The Breakout and Retest Setup
Breakouts attract many traders, but most beginners enter too early. The safest approach is to wait for a retest.
The sequence looks like this:
- Price consolidates near a major level.
- A breakout candle closes clearly above or below the level.
- Price returns to retest the breakout zone.
- A confirmation candle forms in the direction of the break.
This setup works because the retest removes uncertainty. Traders who missed the breakout join, and trapped traders exit, adding momentum to your trade.
4. The Pin Bar + Inside Bar Combo
This powerful combination gives you clarity and timing.
The pattern works like this:
- A pin bar forms at support or resistance.
- The next candle becomes an inside bar.
- Price breaks in the direction of the pin bar.
The pin bar reveals rejection. The inside bar shows consolidation. The breakout confirms direction. Many traders use this combo to catch explosive moves with small stop-losses.
5. The Trend Continuation Setup
Strong trends often pause briefly before continuing. These pauses create opportunities.
Signs of continuation include:
- Shallow pullbacks.
- Higher lows in an uptrend staying above previous structure.
- Lower highs in a downtrend remaining below previous structure.
- Clean rejection candles at dynamic support or resistance (like a 20 EMA).
Although you don’t rely solely on moving averages, they help confirm the trend’s health.
Managing Trades With Price Action
Your entry is only one part of the process. Managing trades correctly separates disciplined traders from emotional ones. Price action gives you several ways to manage trades without relying on external indicators.
1. Stop-Loss Placement Based on Structure
Your stop-loss must sit beyond the level that invalidates your idea. For example, if you buy at support, the stop should sit below the support zone and below the wick that created the entry signal. This placement protects you from minor noise while keeping your risk defined.
2. Letting Winners Run When Structure Supports It
When the trend behaves cleanly, you can hold winners longer. As long as the market prints higher lows in an uptrend or lower highs in a downtrend, structure remains intact. Many traders exit too early because of fear. Structure helps reduce that fear.
3. Scaling Out at Logical Points
Support and resistance help you choose partial profit levels. If price approaches a major resistance zone, scaling out makes sense. If the market breaks through, you can leave a portion running.
4. Avoiding Premature Exits Based on Short-Term Noise
A few small candles against your position don’t invalidate a setup. Only a break of structure or a strong move against your direction gives you a real warning.
Common Price Action Mistakes Beginners Should Avoid
Although price action feels simple, beginners often make predictable mistakes. Avoiding them speeds up your progress.
1. Trading Every Candlestick Pattern
A hammer in the middle of a range means nothing. A doji in the middle of a trend means nothing. Context matters more than the pattern itself. Always combine candles with levels and structure.
2. Drawing Too Many Levels
Too many lines clutter your chart and confuse your decisions. Focus on the clearest levels:
- major swing highs and lows
- fresh zones
- obvious trendlines
When your chart looks clean, your mind becomes clear.
3. Ignoring Market Structure
Structure must always guide your bias. Never trade against it unless you have significant experience and a clear plan.
4. Taking Countertrend Trades Too Early
Trying to catch tops or bottoms damages accounts faster than anything else. Until you master structure, stay with the trend.
5. Letting Emotions Replace Logic
Fear and greed push traders into low-quality trades. A rules-based approach using price action removes emotion.
Case Studies: Realistic Price Action Examples
Although real charts would make these examples visual, you can still follow the logic clearly.
Case Study 1: EUR/USD Bullish Pin Bar Reversal
- Structure: Downtrend weakening.
- Level: Price reaches a major daily support zone around 1.1000.
- Candle: A strong bullish pin bar forms with a long lower wick.
This combination signals heavy rejection. Buyers step in aggressively. A trader who buys above the pin bar and places a stop below the wick often catches a rally of 150–200 pips. The move works well because structure, support, and candle all align.
Case Study 2: GBP/USD Inside Bar Breakout in a Bullish Trend
- Structure: Strong uptrend with consistent higher highs.
- Level: Price pulls back into a 4-hour support zone.
- Candle: Inside bar shows consolidation.
- Breakout: Price breaks above the inside bar and continues upward.
Because everything aligns, the continuation is clean and sharp.
Case Study 3: Trendline Rejection in a Downtrend
- Structure: Lower highs form consistently.
- Level: Trendline rejection aligns with horizontal resistance.
- Candle: Shooting star appears.
The confluence of diagonal resistance, horizontal resistance, and bearish structure creates a high-quality short entry.
Final Conclusion: The Path Toward Mastery
Price action trading gives you a simple but powerful framework. When you understand candles, levels, and structure, the chart stops feeling mysterious. Instead of reacting emotionally, you trade with clarity and purpose. Although the journey takes time, the skills you develop stay with you forever.
As you grow, remember a few core ideas:
- Simplicity beats complexity.
- Structure guides your bias.
- Levels guide your entries.
- Candles guide your timing.
- Patience protects your account.
Start by studying historical charts. Mark highs and lows. Draw support and resistance. Track structure. Then test yourself. Ask what candles reveal and where the next logical move might be. As you practice, your intuition sharpens.
Eventually, you’ll trust your chart reading more than any indicator. Once that happens, you become a trader who sees the market clearly instead of guessing. Your confidence rises. Your discipline strengthens. Your results improve.
Leave a Reply