
Introduction
In the world of business and investing, two metrics often rise to the surface when evaluating how well a company uses its resources: Return on Assets (ROA) and Return on Capital Employed (ROCE). Both are powerful indicators of profitability and efficiency. They show how smartly management is using the company’s assets and capital to create value for shareholders.
Although they sound similar, ROA and ROCE provide slightly different insights. Understanding both can help investors, analysts, and business owners make smarter financial decisions. So, let’s dive deeper and explore what these ratios really mean, how to calculate them, and why they matter across global markets.
Why Efficiency Ratios Matter?
Every company, regardless of its size or sector, wants to turn its resources into profits. Yet not all companies succeed at doing so effectively. Efficiency ratios like ROA and ROCE tell you how well a company is performing this task.
Investors often look at these numbers before making any investment decision. When a company maintains high returns on its assets and capital, it usually signals good management and strong operational control. On the other hand, weak returns may indicate poor asset use, excess borrowing, or declining demand.
Furthermore, in global markets where competition is fierce, efficiency metrics help investors compare companies across different regions. A manufacturer in India, a tech firm in the U.S., or a bank in Europe may operate under different conditions, but efficiency remains a universal benchmark of strength.
What Is Return on Assets (ROA)?
Return on Assets (ROA) measures how much profit a company earns for every dollar (or rupee, euro, yen, etc.) of its total assets. In simple terms, it shows how efficiently a company turns its assets-like cash, inventory, and equipment-into net income.
Formula:

Breaking It Down:
- Net Income: The profit after all expenses, taxes, and interest.
- Total Assets: Everything the company owns that has value-buildings, cash, machines, patents, inventory, and more.
Example:
If a company has a net income of $10 million and total assets worth $200 million:

This means the company earns 5 cents for every dollar invested in assets.
Why ROA Matters?
ROA is a simple yet powerful indicator. It tells you if the company’s resources are being used efficiently.
A higher ROA means better utilization of assets. It shows that management is squeezing more profit from every dollar invested. Conversely, a low ROA might signal inefficiency or underused assets.
For example, an airline with expensive aircraft might naturally have a lower ROA than a software company that needs fewer physical assets. Therefore, ROA should be compared within the same industry rather than across unrelated sectors.
Globally, asset-heavy industries-like energy, telecommunications, and manufacturing-tend to have lower ROA figures compared to asset-light businesses such as consulting or digital services. Investors should always account for this context when comparing numbers.
Interpreting ROA Across Different Regions
When analyzing global companies, the ROA can vary significantly due to economic conditions, tax structures, and even accounting standards. For instance, European firms often record assets more conservatively than U.S. firms, affecting the ratio’s appearance.
In developing economies, companies might report higher ROA because of lower asset costs. Meanwhile, in developed markets, asset values can be inflated due to high technology investments or property prices.
So, instead of fixating on the number alone, it’s wiser to look at ROA trends over time. If a company consistently improves its ROA, it’s likely moving in the right direction-regardless of where it’s based.
Limitations of ROA?
While ROA is useful, it doesn’t tell the whole story. Here are a few things it misses:
- Debt Levels: ROA doesn’t factor in how much debt a company carries. Two companies can have the same ROA, but one might be heavily leveraged.
- Asset Valuation: Assets may be recorded at historical cost, which may not reflect current market value.
- Industry Differences: As mentioned earlier, comparing ROA between industries can be misleading.
That’s why analysts often look beyond ROA and combine it with ROCE-a broader measure that considers both debt and equity.
What Is Return on Capital Employed (ROCE)?
Return on Capital Employed (ROCE) measures how efficiently a company uses all the capital at its disposal-both debt and equity-to generate profits. In other words, it shows how well the company turns its total capital into returns before paying interest and taxes.
Formula:

Where:

Example:
If a company’s EBIT is $20 million and its capital employed is $250 million:
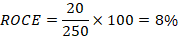
That means the business generates an 8% return on its total capital.
Why ROCE Matters?
While ROA focuses on assets, ROCE gives a broader picture by accounting for both debt and equity. It measures overall capital efficiency and profitability.
A high ROCE means a company is using its funds wisely to generate earnings. For investors, this signals strong management performance and potential for stable returns.
Furthermore, ROCE helps compare companies with different financial structures. A firm that relies more on borrowed funds can still perform well if its ROCE exceeds the cost of borrowing. Conversely, if ROCE falls below the cost of capital, it suggests value destruction.
Global Relevance of ROCE
In global investing, ROCE is often preferred by analysts because it adjusts for variations in leverage and capital mix. Whether you’re evaluating a British bank, an American manufacturing giant, or an Indian energy firm, ROCE gives a more consistent basis for comparison.
For example, global fund managers often use ROCE to identify businesses that can consistently generate returns above their cost of capital, regardless of geography. This consistency signals competitive advantage and long-term sustainability.
It’s no surprise that many blue-chip companies, from Apple to Unilever to Toyota, report ROCE figures prominently in their annual reports.
ROA vs. ROCE: Key Differences
Though ROA and ROCE both measure profitability, they serve different purposes. Let’s break down the main differences:
| Basis | ROA | ROCE |
| Focus | Profit generated from total assets | Profit generated from all capital employed |
| Profit Measure | Net Income | EBIT (Earnings Before Interest and Taxes) |
| Debt Impact | Ignores leverage | Considers leverage |
| Users | Useful for internal efficiency analysis | Useful for investors and creditors |
| Better For | Comparing companies with similar asset structures | Comparing companies with different capital structures |
To put it simply, ROA tells you how well a company uses its assets, while ROCE shows how efficiently it uses its capital. Both ratios complement each other. A smart investor should always analyze them together for a well-rounded view.
Interpreting Both Together
Imagine two companies:
- Company A: ROA = 6%, ROCE = 12%
- Company B: ROA = 6%, ROCE = 7%
Even though both have the same ROA, Company A clearly manages its capital better. It’s earning more from the same resources.
When both metrics move upward over time, it’s a strong indicator of good management and healthy business operations. However, if ROA improves but ROCE drops, it might mean growing inefficiency in managing borrowed capital.
The Role of Debt and Leverage
Debt plays a crucial role in shaping both ratios. A company with heavy borrowing may have a low ROA because its asset base is large, but it might still maintain a strong ROCE if it earns enough to cover interest payments.
However, excessive leverage can distort returns. During good times, returns look higher due to borrowed funds. But when markets slow down, interest obligations can crush profits. Therefore, investors often use ROCE to gauge whether a company’s returns justify its debt levels.
Practical Application for Global Investors
For global investors, understanding ROA and ROCE helps compare companies across borders. Let’s consider a few cases:
- Technology Sector: U.S.-based tech giants often have high ROA and ROCE due to their digital business models.
- Manufacturing Sector: Japanese or German manufacturers may show moderate ROA but strong ROCE because of disciplined capital management.
- Emerging Markets: Indian or Southeast Asian firms might display volatile ROA and ROCE due to fluctuating asset values or evolving industries.
By studying both ratios, investors can spot resilient businesses capable of sustaining profitability across market cycles.
How Companies Improve ROA and ROCE
To boost these metrics, companies often take practical steps such as:
- Optimizing Asset Usage: Selling idle or non-performing assets.
- Cutting Operational Costs: Streamlining processes to improve margins.
- Efficient Capital Allocation: Redirecting funds toward high-return projects.
- Reducing Debt: Lowering interest burden to improve ROCE.
- Innovation: Using technology to increase asset productivity.
When these efforts are consistent, both ROA and ROCE rise over time-showing that management is creating long-term value.
Common Misinterpretations
While these ratios are valuable, they’re not infallible. Analysts sometimes overemphasize short-term changes. A one-time gain or asset sale can temporarily inflate ROA or ROCE. Similarly, sudden write-offs can make ratios look worse than they truly are.
Additionally, companies in high-growth phases might reinvest profits into expansion, lowering their current returns but building stronger future potential. Therefore, context always matters when reading these numbers.
ROA and ROCE During Economic Cycles
During economic booms, both ROA and ROCE typically rise as demand increases and profits grow. But when recessions hit, returns often fall.
Interestingly, companies with strong fundamentals maintain decent ROCE even in downturns, while weaker firms see sharp declines. That’s why these ratios are especially useful for identifying resilient businesses in volatile markets.
Globally diversified investors use these figures to decide which regions or sectors are worth staying invested in during uncertain times.
Case Study: Global Companies
Apple Inc.
Apple consistently reports a high ROA and ROCE thanks to its efficient asset-light design and strong pricing power. Its ROCE often exceeds 30%, showing how well it converts capital into profit.
Toyota Motor Corporation
Toyota operates in a capital-heavy industry but still manages a solid ROCE due to its lean manufacturing system. It demonstrates that even asset-intensive companies can achieve excellent capital efficiency through discipline.
Unilever
Unilever’s stable global operations reflect strong ROCE, often around 15–18%, supported by consistent consumer demand and balanced use of debt and equity.
These examples prove that strong returns are not limited to any single industry or region-they result from efficient management and strategic focus.
Key Takeaways for Businesses
For business owners and managers, monitoring ROA and ROCE isn’t just about pleasing investors. It’s about running the company efficiently.
A rising ROA means the company is improving how it uses its resources. A healthy ROCE means the company is generating good returns for all capital providers.
Together, they guide better decision-making-whether it’s expanding capacity, refinancing debt, or investing in innovation.
How Analysts Use ROA and ROCE Together?
Financial analysts often combine these ratios with others like Return on Equity (ROE) and Debt-to-Equity Ratio for a complete picture.
For example:
- If ROA and ROCE are both strong, the company likely manages its assets and capital efficiently.
- If ROA is strong but ROCE is weak, capital structure may be inefficient.
- If both are falling, profitability or asset utilization may be deteriorating.
Using them together provides clarity that no single ratio can deliver.
Limitations and Cautions
No financial ratio should be used in isolation. Both ROA and ROCE rely on accounting data, which can differ across countries. Additionally, asset revaluation, depreciation methods, and inflation can distort the numbers.
That’s why investors should always cross-check with cash flow, margin analysis, and qualitative factors like management quality or competitive position.
The Bottom Line
ROA and ROCE are two sides of the same coin-one reflects how well a company uses its assets, the other shows how efficiently it employs capital. When used together, they reveal a company’s true profitability potential.
In a global economy where capital flows across borders and industries evolve rapidly, understanding these ratios helps investors and businesses stay ahead.
So, the next time you evaluate a company, don’t just glance at its profits. Look at how those profits are being earned. A business that maintains strong ROA and ROCE over time isn’t just growing-it’s thriving.
Leave a Reply