
Candlestick patterns sit at the center of technical analysis because they show real-time shifts in market psychology. When you understand them well, you gain a clearer view of how buyers and sellers behave at each moment. As a result, you start predicting potential price movement far earlier than traders who rely on lagging tools. Throughout this guide, we will look closely at how candlesticks work, why traders around the world trust them, and how you can use them in your own trading decisions. Moreover, you’ll see the emotional story behind each pattern and learn how to combine these signals with indicators, volume, and key price levels. By the time you finish this full guide, candlestick reading will feel intuitive, and you will approach the market with much more confidence.
What Exactly Are Candlestick Charts and How Do They Work?
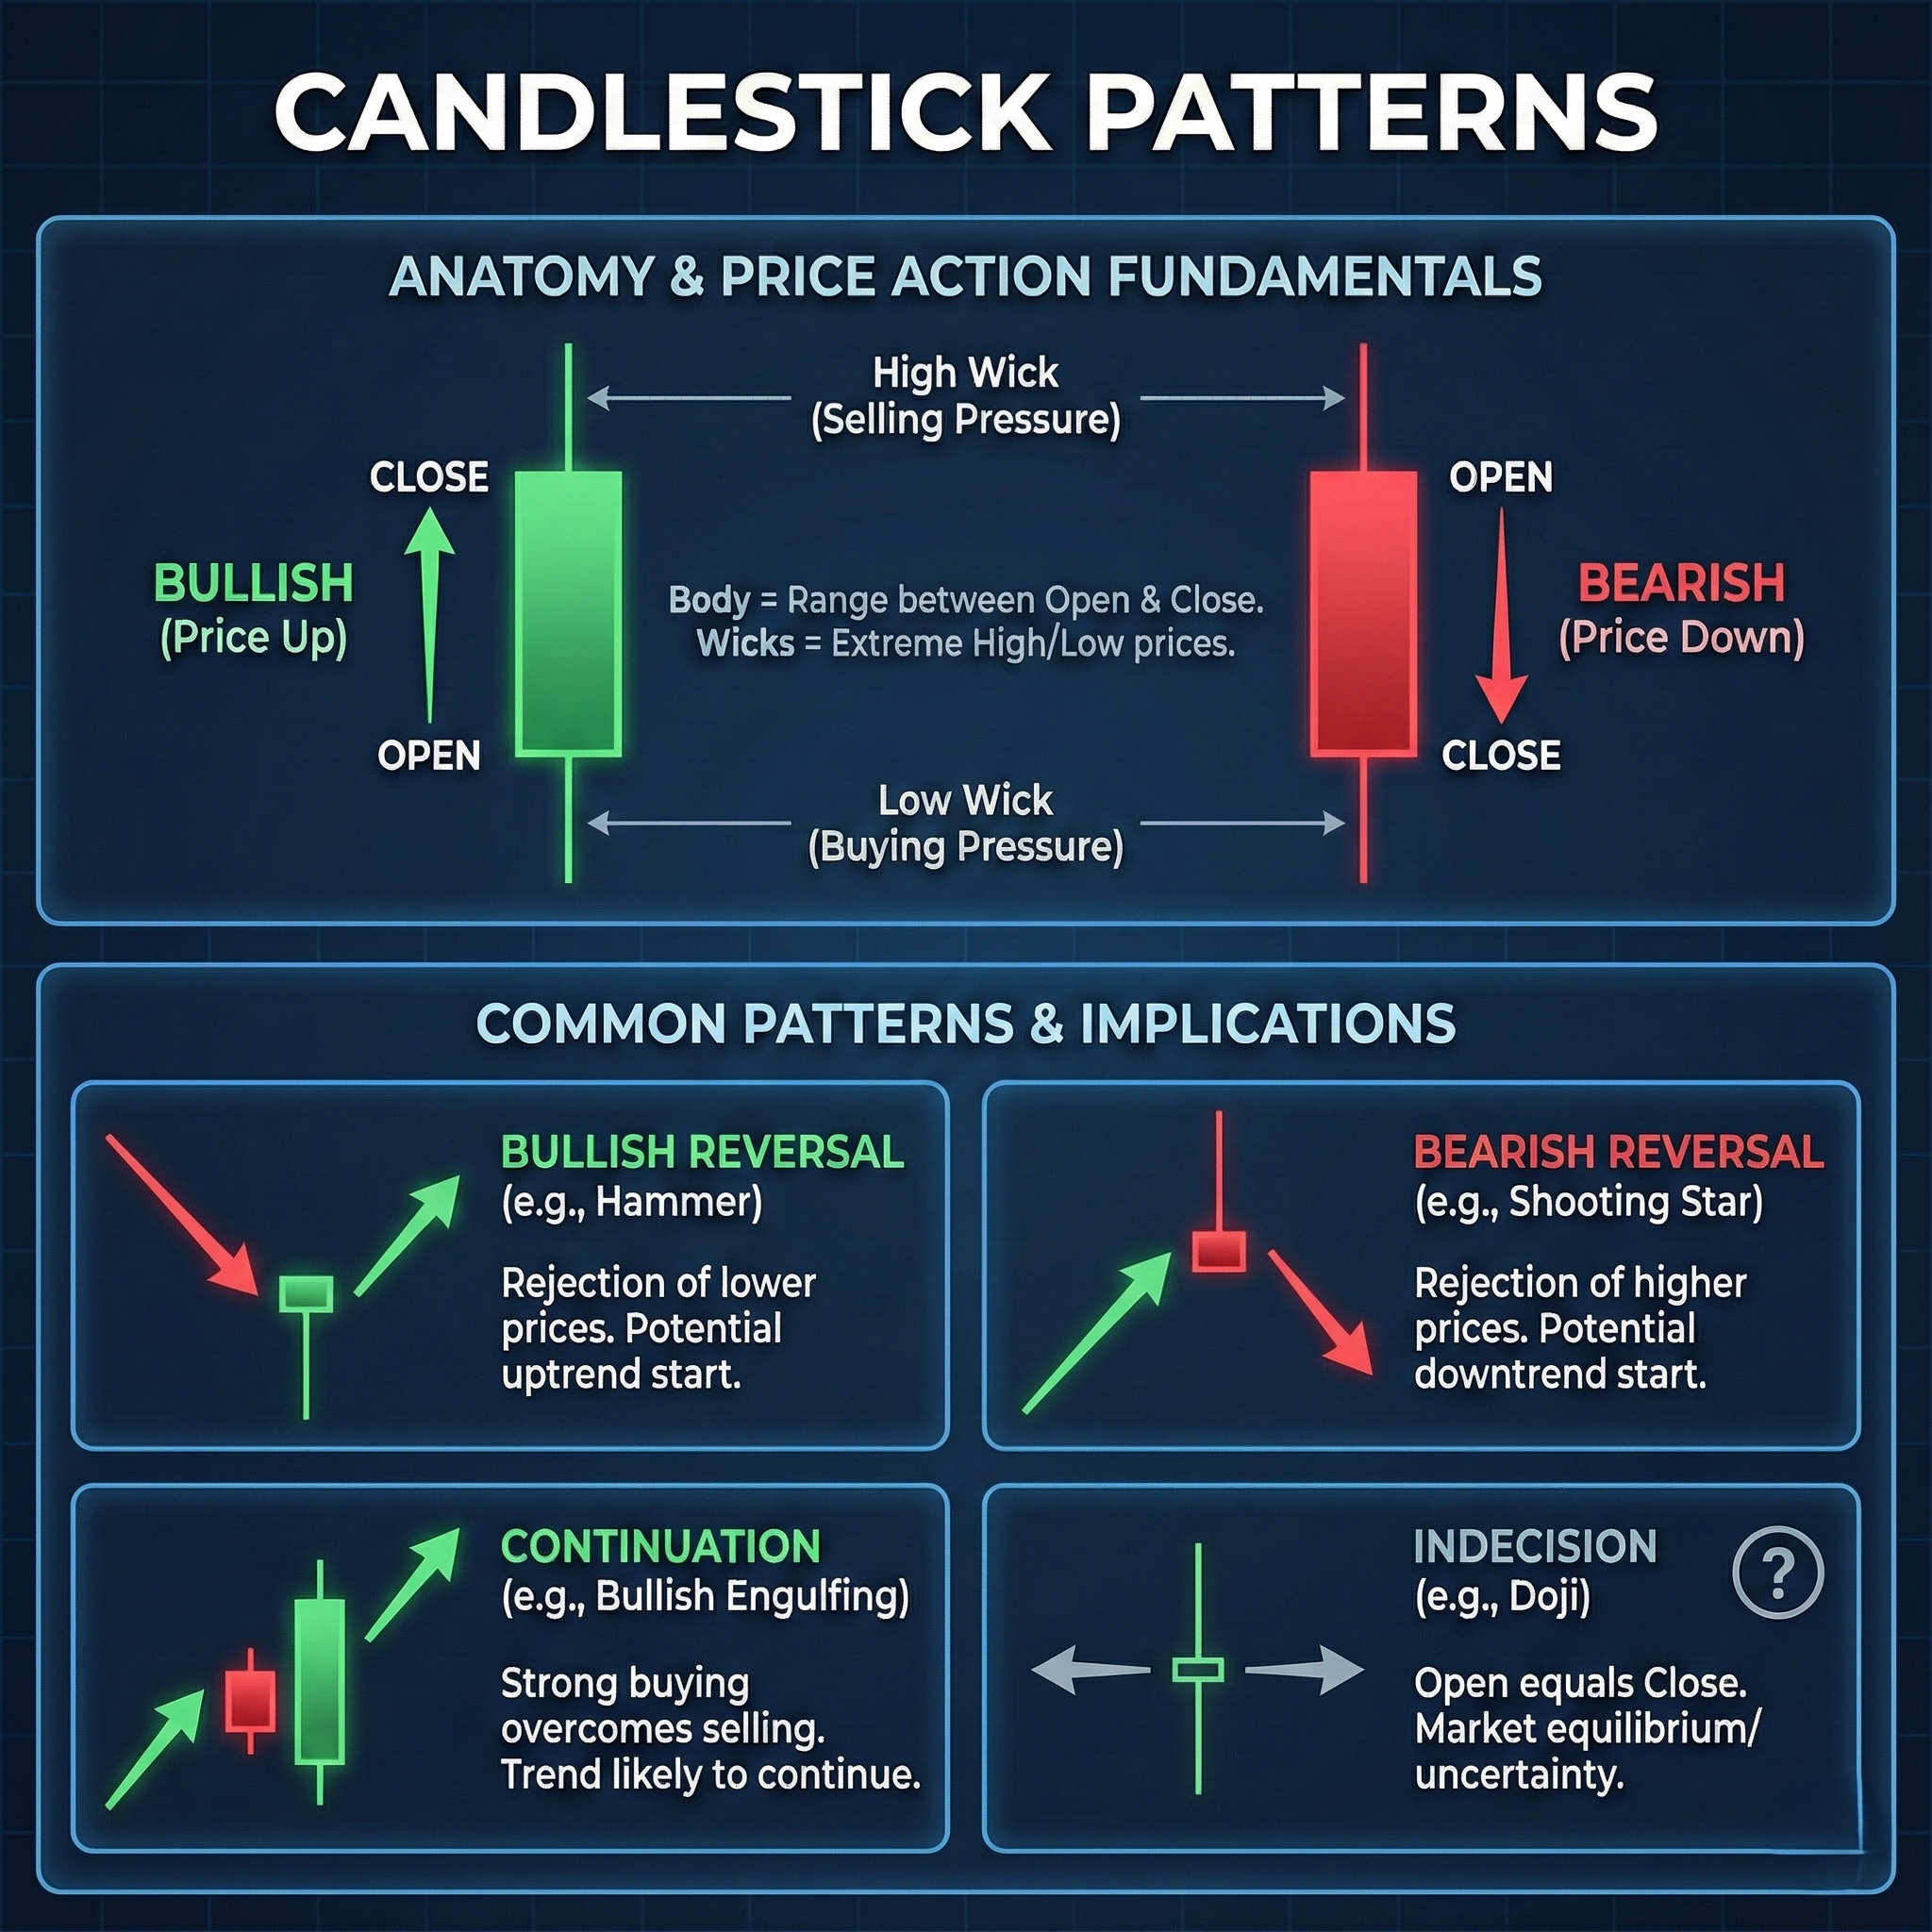
Before we dive into individual patterns, we need to understand what a candlestick represents. Every candle shows four essential data points from a chosen timeframe: the opening price, the closing price, the highest price, and the lowest price. These four pieces of information form the backbone of price action. Since traders react to these levels constantly, each candle displays the tug-of-war between buyers and sellers during that period.
The body of the candlestick shows the range between open and close. When the candle is green or white, price closed higher than it opened, which signals that buyers held control through the session. When the candle is red or black, price closed lower than it opened, which signals that sellers dominated the session. Although the colors look simple, they reveal which side won the fight at that moment.
Above and below the body sit the wicks, also known as shadows or tails. These thin lines show the extreme highs and lows reached during the session. When a candle has a long upper wick, price attempted to move higher but failed to hold those gains. When a candle has a long lower wick, price dropped sharply but buyers stepped in and pushed it back up. Therefore, wicks often show where the market rejected certain price levels.
Sometimes you’ll see candles with no shadows at all. These are called Marubozu candles, and they show strong conviction because price moved in one direction without hesitation. Other times you’ll see Doji candles, where the open and close sit nearly at the same level. A Doji shows hesitation or balance between both sides, and it often appears before major market shifts.
Understanding the Basic Components: Body and Shadows
The body of a candle tells the story of strength. A long green body shows aggressive buying, while a long red body shows heavy selling. Short bodies, however, show uncertainty. When multiple short-bodied candles appear in a row, the market may be waiting for fresh information before making a bigger move. Because of that, traders use body size to judge momentum at a glance.
The upper and lower shadows provide more detail. A long upper wick shows that buyers attempted to push price higher but eventually lost control. A long lower wick shows that sellers dropped price lower but failed to hold those levels. As a result, wicks highlight areas of price rejection, which often become important support or resistance zones later.
Occasionally you’ll notice candles with bodies but almost no shadows. These Marubozu candles reveal strong dominance from one side. When price moves steadily upward or downward without interruption, it reflects clear commitment from traders. On the opposite end, a Doji shows hesitation, which makes it valuable during potential turning points.
Because each candle reveals a small piece of emotional behavior, reading them well gives you insight into sentiment shifts long before they appear on indicators.
Single-Candle Patterns: Learning the Foundation
Before exploring multi-candle formations, you must understand common single-candle signals. These patterns often appear during turning points, and they help you judge whether momentum is fading or building.
The Hammer
A Hammer appears after a downtrend. It has a small body near the top and a long lower wick, usually at least twice the length of the body. Although sellers push price down early in the session, buyers step in and lift it back up. Because of that strong recovery, a Hammer often signals the beginning of a bullish reversal. A green Hammer usually carries more strength than a red one, but both show that buyers are re-entering the market.
The Shooting Star
The Shooting Star is the opposite of the Hammer, but it forms at the top of an uptrend. It has a small body and a long upper wick. Price moves higher at first, but sellers jump in aggressively and push it back down. When this happens during a strong uptrend, traders treat it as a warning sign that buying pressure may be slowing.
The Inverted Hammer
The Inverted Hammer looks identical to a Shooting Star, but context gives it a different meaning. When it appears after a downtrend, it shows that buyers attempted to push price higher but couldn’t close strong. Even so, the attempt alone signals growing buyer interest. If the next candle confirms strength, this pattern can lead to a bullish reversal.
The Doji and Its Variants
Doji patterns deserve special attention because they appear in many different situations.
- Dragonfly Doji: Long lower wick, open and close at the top. Often appears at the bottom of downtrends.
- Gravestone Doji: Long upper wick, open and close at the bottom. Often appears near market tops.
- Standard Doji: Open and close almost equal with small wicks. Shows indecision.
Because Dojis represent balance, traders look for confirmation in the next candle before acting.
Two-Candle Patterns: Where Trading Opportunities Become Clear
As we move to two-candle formations, patterns become more powerful. These combinations show a clearer transfer of control between buyers and sellers.
Bullish Engulfing
A Bullish Engulfing appears at the bottom of a downtrend. The first candle is small and red. The second is large and green, and its body fully covers the previous candle’s body. This shift shows that buyers stepped in with strong force. Since the reversal is clear and decisive, traders often use this pattern as a signal to look for long entries.
The psychology behind this pattern matters. On day one, sellers continue pushing price lower. On day two, buyers arrive so strongly that they erase the prior day’s loss and close above the previous open. This sudden shift in momentum often marks the beginning of a trend change.
Bearish Engulfing
The Bearish Engulfing is the opposite. It forms at the top of an uptrend when a large red candle completely covers a small green candle. When sellers take control this aggressively, the pattern warns that buying strength may be exhausted.
The Piercing Line
The Piercing Line pattern is a bullish signal that forms after a strong red candle in a downtrend. The next candle opens lower but closes above the midpoint of the red candle. Since buyers recover more than half the previous loss, the pattern signals the start of a potential reversal. Although it is strong, traders usually wait for confirmation.
Bullish and Bearish Harami
A Harami features a large candle followed by a smaller candle fully contained within the first body. The Bullish Harami forms during a downtrend when the second candle is green. It shows that selling pressure is weakening. A Bearish Harami appears during an uptrend when the second candle is red, suggesting that buyers may be slowing down.
These patterns don’t show full reversals by themselves, but they often warn that a trend is losing strength.
Three-Candle Patterns: Complex Formations That Reveal Major Reversals
Three-candle formations tell a deeper story because they show momentum shifting step by step. Since each candle adds another layer of information, these patterns often mark meaningful turning points.
The Morning Star
The Morning Star is one of the most reliable bullish reversal patterns. It appears after a downtrend and includes three distinct candles. First, a long red candle shows that sellers still dominate. Next, a small candle appears, which may be red or green. This middle candle usually gaps down and shows hesitation. Finally, a strong green candle forms and closes well into the first candle’s body. Because the third candle confirms the reversal, the Morning Star signals that buyers have taken control.
The structure of this pattern is powerful. Sellers push the market lower in the first candle. The second candle reveals exhaustion or uncertainty. The third candle shows buyers regaining strength and reversing the pressure. As a result, traders treat the Morning Star as a high-probability signal when it forms at support levels.
The Evening Star
The Evening Star works as the bearish counterpart. It forms after an uptrend and warns of an upcoming decline. The first candle is a strong green candle that continues the uptrend. The second candle is small and often gaps up, hinting that buyers may be running out of momentum. The third candle is a long red candle closing deep into the first candle’s body. When this structure forms near resistance, traders expect the trend to reverse.
Three White Soldiers
The Three White Soldiers pattern shows a powerful shift toward bullish sentiment. It consists of three consecutive long green candles that open within the previous candle’s body and close progressively higher. These candles should have small or no upper shadows, which shows steady buying throughout. Because this pattern forms after a downtrend, traders see it as a strong sign that a new uptrend may be developing.
Three Black Crows
The Three Black Crows pattern is the opposite. It includes three long red candles that open near the previous close and end progressively lower. When this forms after an uptrend, it signals strong selling pressure and a possible trend reversal. Since sellers remain in control across all three sessions, the pattern reflects consistent bearish sentiment.
Continuation Patterns: Recognizing When Trends Will Resume
Not every pattern signals a reversal. Many patterns show that a trend is pausing before continuing in the same direction. When traders understand these formations, they can hold winning trades longer and avoid exiting too early.
Doji as a Continuation Signal
Although a Doji often signals indecision, its meaning depends on context. When a Doji appears in the middle of a strong trend, it may simply mark a short pause. If the next candle continues in the direction of the trend, the market usually resumes its movement. Because of this, traders look for confirmation rather than assuming a reversal too soon.
The Spinning Top
A Spinning Top shows balance between buyers and sellers, with both upper and lower shadows present. The body is small, showing limited progress from either side. This pattern often appears during consolidation phases. Since neither side takes control, traders wait for the next candle to reveal the direction. When Spinning Tops appear inside strong trends, they typically lead to continuation.
Rising Three Methods
The Rising Three Methods pattern appears in uptrends and confirms continuation. It starts with a strong green candle. Then three small candles follow, moving slightly downward or sideways but staying within the first candle’s range. Finally, a long green candle closes above the entire formation. This structure shows that buyers remain in control even though the market paused for a few sessions. Because selling pressure failed to break the trend, traders view this pattern as a reliable continuation signal.
Falling Three Methods
The Falling Three Methods is the bearish version. It begins with a strong red candle. Then three small candles appear that move upward or sideways within the first candle’s range. At the end, a long red candle forms and confirms the continuation of the downtrend. Since buyers fail to reverse the movement during the pause, sellers remain firmly in control.
The Critical Role of Confirmation in Successful Trading
No candlestick pattern should be traded blindly. Confirmation is essential because markets often create similar shapes during noise or temporary volatility. Traders who rely on confirmation typically experience fewer false signals and more consistent outcomes.
Why Confirmation Matters
Candlestick patterns reflect emotional behavior, but price must follow through for the pattern to hold meaning. For instance, after a Bullish Engulfing pattern, traders usually wait for another strong green candle to confirm buyer strength. Without this follow-up action, the reversal may not last.
Volume as Confirmation
Volume is one of the most valuable confirmation tools. When a candlestick pattern forms with noticeable volume, it shows commitment from traders. If a Bullish Engulfing pattern appears with high volume, buyers are truly stepping in rather than reacting weakly. Since volume reflects participation, it boosts confidence when entering trades.
Patterns that form with weak volume often fail quickly. When traders ignore volume, they frequently fall into traps created by small, low-liquidity moves. Therefore, volume analysis should always accompany candlestick reading.
Support and Resistance as Confirmation
Support and resistance levels add another layer of reliability. When a reversal pattern appears at a strong support level, the probability of a bounce increases. When a bearish pattern appears at resistance, the likelihood of a drop increases as well. Because markets often respect these zones, candlestick patterns that form there carry more weight.
Moving Averages as Confirmation
Moving averages help traders judge the broader trend. A bullish pattern that forms near a rising 50-day moving average carries more strength than one forming far from key trend areas. Similarly, a bearish pattern that forms near a declining moving average reinforces the existing direction.
By combining candlestick patterns with moving averages, volume, and support/resistance levels, traders build a strong decision-making system.
Common Mistakes Traders Make When Using Candlestick Patterns
Many traders study candlestick patterns but still struggle because they apply them without structure. Although the patterns themselves are powerful, using them carelessly often leads to poor decisions. Understanding these common mistakes helps you avoid results that feel random or inconsistent.
Relying on a Single Pattern Without Context
One of the biggest mistakes involves focusing on a single candle or pattern without considering the broader trend. A Bullish Engulfing candle that forms during a strong downtrend may cause a small bounce, but the larger trend might still push price lower. Since the bigger picture always influences short-term price movement, traders must examine the trend before interpreting any pattern.
Ignoring context makes patterns misleading. Trends, momentum, volume, and support levels all strengthen or weaken the message of a candle. Therefore, traders who want clarity must look at the full chart instead of isolating one signal.
Ignoring Volume Analysis
Another major mistake involves skipping volume analysis. Some traders focus entirely on the candle shape and color yet forget to check whether the move has real strength behind it. When a reversal pattern appears with low volume, it may not represent true conviction. Because volume shows how many traders participated in the move, it gives you insight into whether the pattern has real weight.
Patterns supported by high volume have a much higher likelihood of success. Since heavy volume reflects strong conviction, it confirms that either buyers or sellers truly committed to that shift.
Trading Only on Very Short Timeframes
Many beginners rush to trade candlestick patterns on 1-minute or 5-minute charts. While these charts offer more candles to study, they also contain far more noise. A pattern that seems clear on a 1-minute chart might vanish or look insignificant on a higher timeframe. Because higher timeframes smooth out random fluctuations, patterns formed there offer far more reliability.
As a result, traders should review patterns on multiple timeframes to avoid acting on misleading signals.
Poor Stop-Loss Placement
Some traders misunderstand how to set stop losses around candlestick patterns. When a pattern forms, its high or low often becomes the logical boundary for risk. However, many traders place stops too close, which exposes them to normal price fluctuations rather than true pattern failure. Conversely, placing stops too far away creates a poor risk-to-reward ratio.
Correct stop placement depends on the structure of the pattern. A Hammer requires a stop below its low. A Shooting Star requires a stop above its high. When traders respect these boundaries, they protect themselves without choking the trade.
How to Use Candlestick Patterns in a Real Trading Strategy
Learning candlestick patterns is valuable, but applying them strategically is the real key. A consistent method prevents emotional decisions and helps you focus on high-probability setups.
Step 1: Identify the Trend on Higher Timeframes
Start by checking the overall trend on the daily or weekly chart. When the higher timeframe trend is clear, any pattern that aligns with it carries more strength. Although short-term charts show more detail, they often confuse traders because they move quickly.
A Hammer during a long-term uptrend or a Shooting Star during a long-term downtrend often gives stronger results than a pattern fighting against the dominant direction.
Step 2: Mark Key Support and Resistance Levels
Next, highlight significant support and resistance zones. Price usually reacts to these areas, and patterns that form there often lead to bigger moves.
Support levels often attract bullish reversal patterns like Hammers or Bullish Engulfing candles. Resistance levels usually attract patterns like Shooting Stars or Bearish Engulfing candles. Because these levels shape trader behavior, combining them with patterns increases accuracy.
Step 3: Wait for Confirmation
After spotting a pattern, wait for confirmation from the next candle. A reversal needs follow-through to prove strength. A Bullish Engulfing pattern followed by a weak candle reduces confidence. Meanwhile, a strong follow-up candle boosts the probability of success.
Patience prevents traders from acting too quickly. Although waiting can feel challenging, it significantly improves results.
Step 4: Place a Logical Stop-Loss
Once price confirms the pattern, place your stop-loss just beyond the extreme of the formation. This protects your capital while giving the trade space to move naturally.
Because candlesticks reflect emotional swings, stops should sit outside those emotional extremes. When you place them correctly, you reduce the chances of being stopped out due to normal volatility.
Step 5: Manage the Trade With Structure
After entering the trade, monitor the trend, momentum, and volume. If the trade moves in your favor, look for new support or resistance levels to adjust your stop-loss. Managing the trade with discipline matters as much as finding the setup.
Combining Candlestick Patterns With Other Technical Indicators
Candlestick patterns become more accurate when paired with other tools. Although patterns alone provide valuable insight, indicators help confirm or filter signals, leading to better decision-making.
Using Moving Averages
Moving averages help traders understand trend direction. When a bullish pattern forms above a rising moving average, the trade aligns with momentum. If the same pattern forms below a declining moving average, the signal weakens.
For example, a Bullish Engulfing candle that forms near a rising 50-day moving average shows strong potential. Because the trend supports the signal, the chance of success increases.
Using RSI
The Relative Strength Index (RSI) measures whether a market is overbought or oversold. When a bullish reversal pattern forms during oversold conditions, the setup becomes stronger. Likewise, bearish patterns formed during overbought conditions gain credibility.
RSI divergence adds even more weight. If price makes a new low while RSI does not, a Bullish Engulfing pattern becomes even more meaningful.
Using MACD
MACD helps traders analyze momentum shifts. When a bullish pattern forms as the MACD crosses upward, both tools point in the same direction. Because the pattern and the indicator agree, traders gain more confidence.
Using Support and Resistance
Support and resistance levels remain the simplest yet most effective confirmation tools. Candlestick patterns that form at these areas perform significantly better than those in random locations.
When price reacts at these levels, it often reflects broader market psychology. Because of that, combining patterns with these levels can dramatically improve accuracy.
Practicing and Mastering Candlestick Pattern Recognition
Mastering candlestick patterns takes time, consistent practice, and a structured approach. Although the concepts look simple on the surface, recognizing these patterns accurately during real market movement requires patience. Because market conditions shift constantly, traders must build experience through repetition.
Study Textbook Examples First
Start by reviewing clean, textbook examples of each pattern. These charts make learning easier because they remove distractions and noise. As you become familiar with the structure and psychology behind each pattern, real-world charts will feel less confusing. Although these perfect examples rarely appear in the market, they form the foundation for everything else.
Practice on Historical Charts
Next, begin practicing with historical charts. Since you already know how the chart played out, you can focus purely on pattern recognition. This method removes emotional pressure and lets you analyze each setup calmly. While reviewing past charts, pay attention to how patterns behave near support, resistance, trend lines, and moving averages. Because these elements strengthen or weaken patterns, noticing them early improves your trading decisions later.
Use Multiple Timeframes
Once you grow more comfortable, start analyzing several timeframes together. A pattern that appears strong on a 5-minute chart may look insignificant on a daily chart. However, when patterns align across timeframes, they carry more weight. For example, a Hammer on the hourly chart combined with a Bullish Engulfing on the daily chart shows powerful buying interest. Since the market behaves differently across timeframes, understanding these interactions increases your accuracy.
Studying patterns this way also teaches you which timeframes produce the most reliable signals. Many traders eventually shift toward higher timeframes because they filter out noise and create clearer patterns.
Use Tools Without Relying Completely on Them
Automated pattern-recognition tools can speed up your learning. These tools highlight potential patterns, which helps you check your understanding. Even though automation can save time, you should never depend on it fully. Some tools misidentify candles or ignore important context, so manual verification still matters. As you practice, you’ll notice how automation and human judgment complement each other.
Keep a Detailed Trading Journal
A trading journal is one of the most important tools for improving pattern recognition. Inside your journal, record the pattern you identified, the chart timeframe, the support or resistance level involved, the confirmation candle, the volume, and the final outcome of the trade. Over time, patterns will reveal which setups work best for you.
Although journaling takes discipline, it offers insight that no book can provide. Because markets evolve, you may notice that certain patterns perform well during trending periods but fail during choppy markets. Keeping track of these details helps you adapt faster than traders who rely only on memory.
Review and Adjust Your Approach Regularly
As you collect more data, review your journal and performance. Look for repeated mistakes, such as entering trades too early or placing stops too close. Adjust your strategy based on what you observe rather than relying solely on theory. Since markets reward consistency and adaptation, your progress will speed up if you refine your approach regularly.
Conclusion: Your Journey Toward Profitable Pattern Trading
Candlestick patterns offer a powerful way to read market psychology. Because they show real-time emotion and behavior, they allow traders to anticipate price movement far earlier than most indicators. Throughout this guide, you explored how candles form, what their bodies and shadows represent, and how to interpret single, double, and triple-candle formations. Additionally, you learned how to use continuation patterns to stay with a trend instead of exiting too soon.
You also saw why confirmation plays such an important role. Volume, support and resistance, moving averages, and trend direction all strengthen or weaken a pattern. When these elements align with a candlestick formation, the probability of success rises sharply.
Although candlesticks provide valuable insight, no pattern works every time. Therefore, traders must use them as part of a structured system rather than a stand-alone tool. When you combine candlestick analysis with proper risk management, strong confirmation signals, and disciplined execution, you create a repeatable trading process.
As you continue your journey, start by focusing on higher timeframes where patterns form more clearly. Then practice on historical charts, maintain a detailed journal, and refine your strategy over time. Although mastery takes patience, every hour you invest in learning price action builds confidence.
With consistent practice, candlestick analysis becomes second nature. Each pattern will reveal a story about buyers and sellers, and each shift in momentum will feel more familiar. When you reach that point, your understanding of the market becomes far deeper, and your trading decisions become more intentional.
Leave a Reply